
Aircraft Ownership · analysis
Business Jet Departures vs Flight Hours: Choosing the Right Activity Measure
Understand how departures and hours can move in opposite directions, calculate average sector duration and compare activity using consistent populations and units.


A report showing more business jet departures can sit beside another showing fewer flight hours without either being wrong. More aircraft may be flying shorter sectors, or the reports may be measuring different aircraft, places or periods.
Understanding business jet departures versus flight hours starts with the question you need to answer. Departures count flying occasions. Hours measure time aloft under the dataset's definition. Neither, on its own, tells you how many passengers traveled, how much charter revenue was earned or whether an aircraft was profitable.
Define the unit before reading the growth rate
Read the methodology before comparing the headline percentages. A departure is a takeoff event; an arrival is a landing event. A movement measure can combine both. Flight hours require a further definition of when the clock starts and stops.
For example, the WINGX data glossary defines hours as wheels-up to wheels-down duration and movements as arrivals plus departures. Those definitions make its hours an airborne measure. They should not be silently substituted for block time or the hours appearing on a charter invoice.
| Measure | What it describes | What it does not establish alone |
|---|---|---|
| Departures | Recorded takeoff events | Passengers, occupancy or revenue |
| Arrivals | Recorded landing events | Unique round trips or customers |
| Movements | Arrival and departure events within the stated scope | A universally equivalent number of flights |
| Airborne hours | Time from takeoff to landing | Taxi time or contractual billing units |
| Block hours | Time measured across the defined ground-to-ground interval | Necessarily the same hours a customer is billed |
| Billed hours | Contractually chargeable time | Exact time in the air |
Take an example of a flight from Airport A to Airport B. It produces one departure at A and one arrival at B. A combined airport dataset may therefore count two movements if both airports are included. If only A is within the selected geography, the observed count may contain just the departure. Dividing every movement total by two is not a reliable way to infer flights without knowing the boundaries and counting rules.
Make the unit visible in your own reporting. “Activity increased 8%” is ambiguous. “Recorded business jet departures from the selected airports increased 8%” tells a reader what was counted and where.
Use departures to count flying occasions
Departures help describe the frequency of operations. An airport, handler or fuel supplier may care about the number and timing of aircraft visits, although departures alone still need to be combined with arrivals, aircraft size and ground-stay patterns for a service forecast.
A flight count is particularly useful when your question concerns how often aircraft operate rather than how far they travel. Ten short flights create more takeoff and landing events than one long flight, even if the total airborne time is identical. That distinction matters when evaluating activity patterns across airports or mission types.
Do not turn those occasions directly into passengers. A departure could carry several travelers, one traveler or no passengers. Activity datasets can include positioning, maintenance-related or other non-revenue flying unless their methodology and filters exclude those operations.
Likewise, a change in departures does not establish a change in charter sales. An operator might reposition more frequently while customer flying remains flat. A corporate fleet might increase owner travel without selling any charter. Identify the flight purpose or operator segment where the dataset supports it, and describe uncertainty where it does not.
For an airport-service analysis, look at the distribution as well as the total. An extra 50 departures concentrated in two event days creates a different staffing problem from 50 departures spread through a month. The annual growth rate can be identical while the operating implications differ substantially.
Use hours to measure time in the air
Airborne hours are useful for describing utilization intensity and the duration of flying. They can help you investigate whether a fleet is spending more time operating, but they do not capture every relevant maintenance or financial exposure.
Maintenance planning also depends on cycles, calendar intervals and the applicable aircraft and component programs. A move toward shorter sectors can change the relationship between hours and cycles. Treat an aggregate hours series as one operating indicator, not a substitute for serial-specific maintenance status.
Longer flights can increase hours while departures remain flat. Suppose a matched group completes 500 departures in both periods. If average duration rises from 1.5 to 1.8 hours, total hours increase from 750 to 900, or 20%. The group has not created more departures; it has accumulated more time per departure.
That does not prove fuel use or emissions increased by 20%. Aircraft type, payload, routing, flight profile and other mission inputs affect those estimates. Nor does it prove revenue rose by 20%, because rates, flight purpose and billable-time definitions may differ. Avoid using a convenient activity percentage as a universal multiplier.
If you manage aircraft, reconcile external hours with your internal records before using them for operational budgets. A tracking dataset, aircraft log and customer invoice can each be internally consistent while measuring different intervals. The first task is to explain the definitions, then investigate any remaining discrepancy.
Reconcile the measures through average sector length
For the same population of completed flights, total airborne hours equal departures multiplied by average airborne duration. This relationship lets you explain why two activity measures move differently.
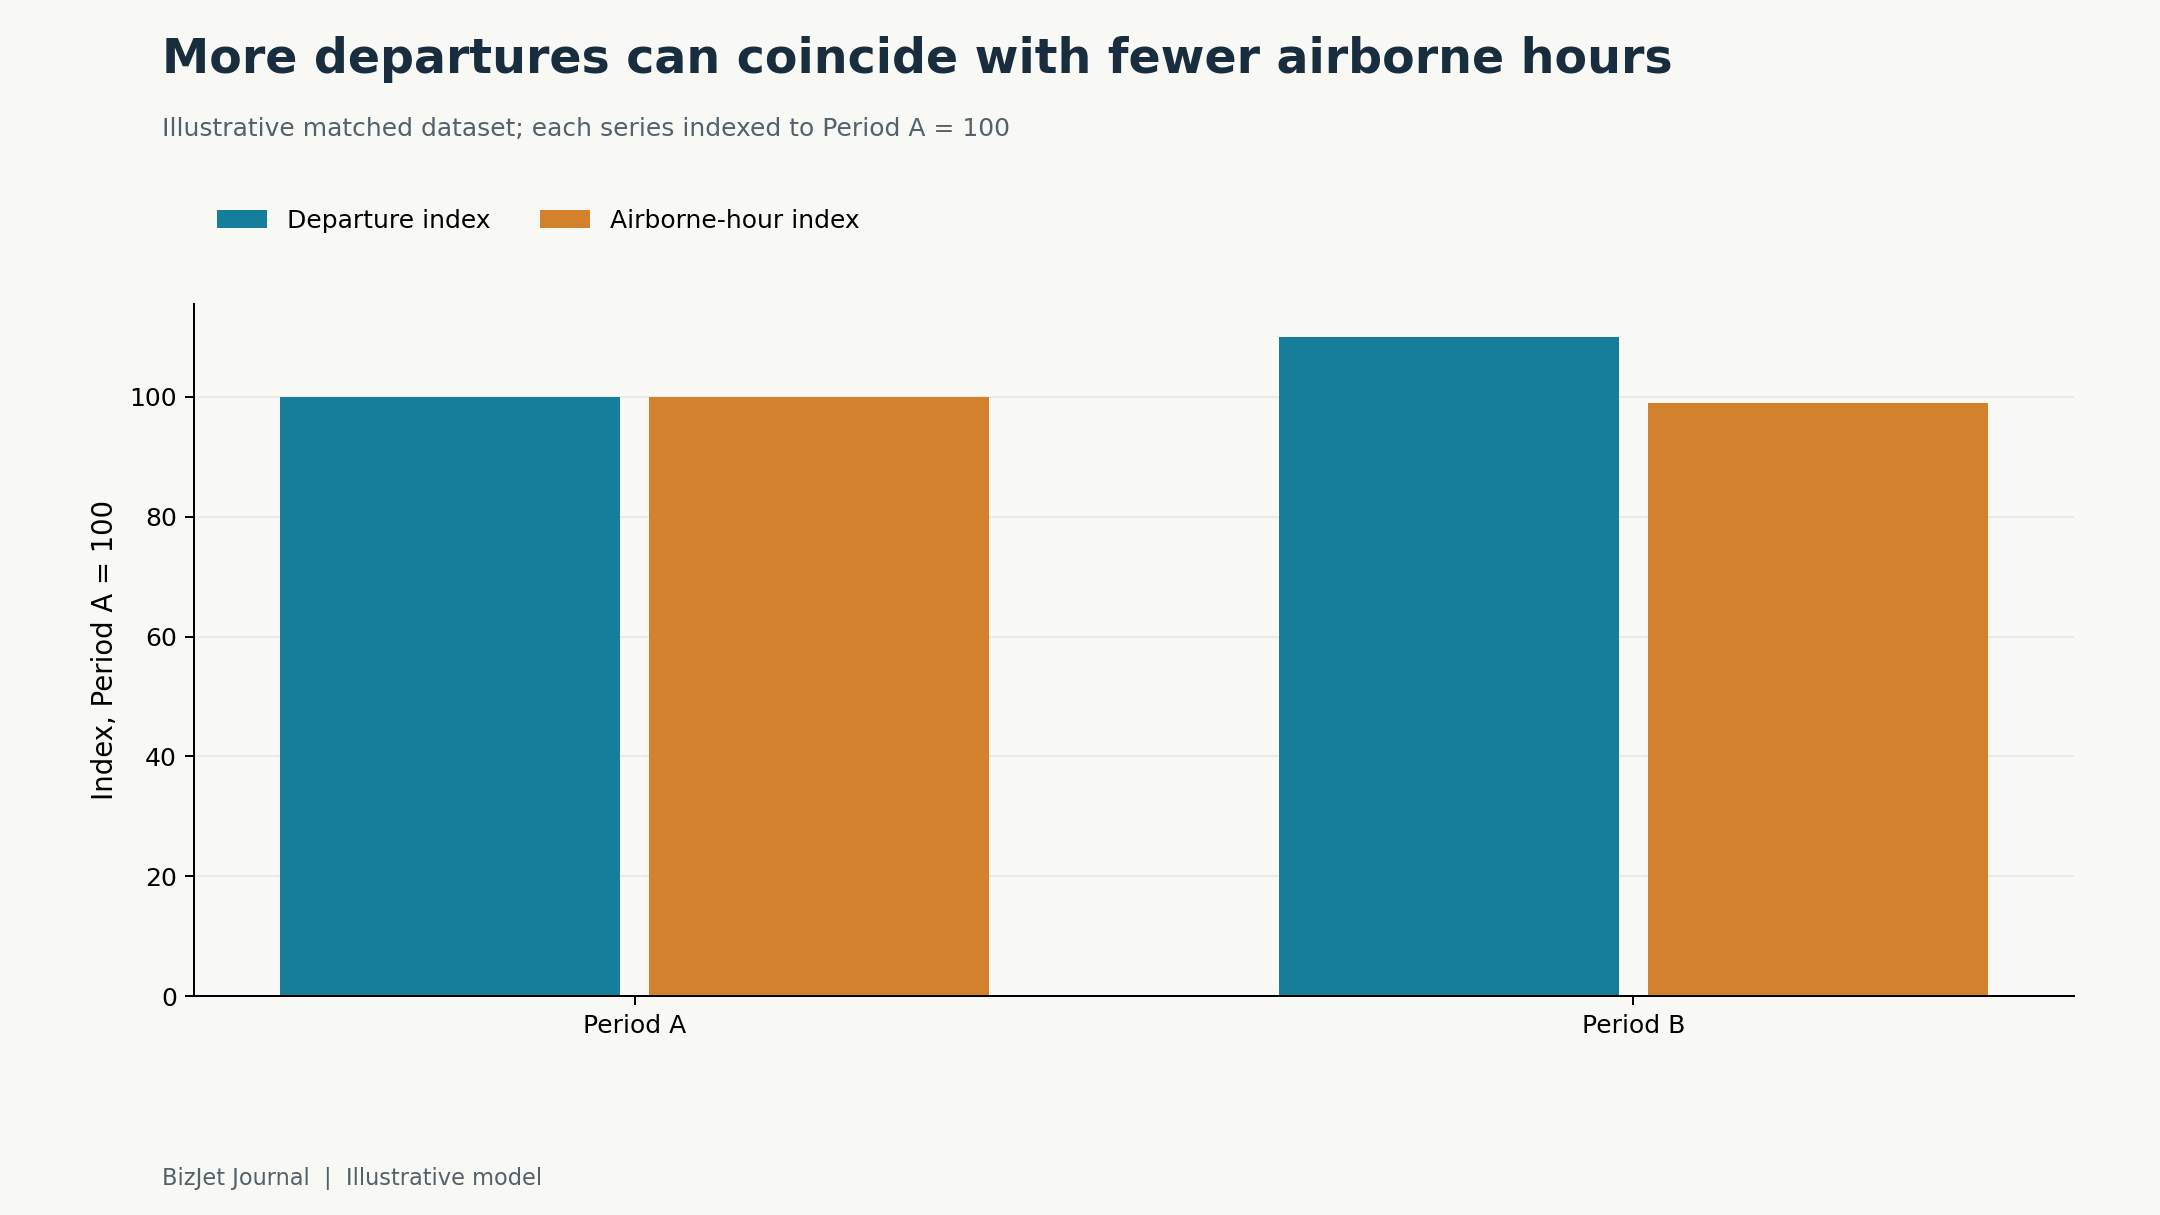
Consider an illustrative matched dataset. Period A has 1,000 departures and 2,000 airborne hours. Period B has 1,100 departures and 1,980 hours. Every flight in this example has a valid duration, and both periods use identical selection rules.
| Metric | Period A | Period B | Change |
|---|---|---|---|
| Departures | 1,000 | 1,100 | +10% |
| Airborne hours | 2,000 | 1,980 | −1% |
| Average duration: hours ÷ departures | 2.0 hours | 1.8 hours | −10% |
| Departure index, Period A = 100 | 100 | 110 | +10 index points |
| Airborne-hour index, Period A = 100 | 100 | 99 | −1 index point |
The arithmetic is multiplicative: 1.10 times 0.90 equals 0.99. A 10% increase in departures combined with a 10% decline in average duration produces a 1% decline in total hours. Simply adding the percentage changes would incorrectly suggest no change.
The next question is what drove the shorter average. Separate aircraft classes, regions and operator groups where the data allows. The result could reflect shorter flights within each group, a greater share of short-sector aircraft, or both. An aggregate average cannot distinguish those explanations by itself.
For example, adding many short flights while leaving long-haul activity unchanged can lower the overall average duration. That does not mean existing long-haul customers shortened their journeys. Compare the same segments over time before assigning a behavioral explanation.
Check the matched sample carefully. If the dataset counts a departure but has no valid arrival time, it may be unable to calculate that flight's duration. Dividing hours from complete records by departures from all records can artificially depress the average. Report the coverage of valid durations or restrict both numerator and denominator to the same usable records.
Keep the data population and denominator fixed
Record the geography, aircraft inclusion, operator filters, date range, time zone and retrieval date. “Business aviation” may include turboprops or piston aircraft in one report while “business jets” excludes them. A global fleet's departures and departures from one country answer different questions, even if the same aircraft appear in both.
The FAA's TFMSC documentation says the system captures IFR flights recorded by its enroute computers, with most VFR and some non-enroute IFR traffic excluded. It also describes incomplete records and monthly updating. That is a specific observation framework, not a census of every aviation movement everywhere.
Commercial datasets can use different collection and processing methods. WINGX's methodology describes multiple sources, UTC timestamps and a typical 24–48-hour reporting lag. A fresh daily observation and a completed monthly dataset should not be presented as equally final merely because they cover some of the same dates.
Compare matched periods. A partial month should be compared with the same elapsed period, with attention to weekdays, holidays and major events where those influence the question. Avoid interpreting a shift in the calendar as a lasting change in demand.
Utilization also depends on the fleet denominator. In a separate illustration, 1,000 hours divided by ten active aircraft equals 100 hours per active aircraft. Dividing the same hours by a 20-aircraft total fleet gives 50 hours per fleet aircraft. Both calculations are correct; they answer different questions. Specify what makes an aircraft “active” and whether that definition changes across periods.
Our guide to registered versus active business jet fleets explains that denominator problem in more detail.
Frequently asked questions
Can departures rise while flight hours fall?
Yes. If average flight duration declines enough, more departures can produce fewer total hours. In the illustrative example, departures rise 10% and average duration falls 10%, producing a 1% decline in hours. Confirm that both series cover the same flights and that missing duration data is not creating the apparent divergence.
Are airport movements the same as flights?
Not necessarily. A movement measure can count arrivals and departures separately. One flight can therefore contribute events at both ends, depending on the geography and reporting scope. Check whether the report counts events, sectors or unique aircraft journeys before comparing it with a flight total.
Do business jet activity figures include empty positioning flights?
They can. A tracking-based flight count does not inherently establish whether passengers were aboard or whether the flight generated revenue. Review the dataset's inclusion rules and any flight-purpose filters. If occupancy or purpose is unknown, describe the number as aircraft activity rather than passenger demand or charter sales.