

The business jet market is entering its next growth phase with more aircraft being delivered, substantial manufacturer order books and a larger role for fleet operators. But the headline market value only tells part of the story. A light jet entering a fractional fleet, a privately owned long-range aircraft and a 15-year-old jet changing hands represent very different kinds of demand.
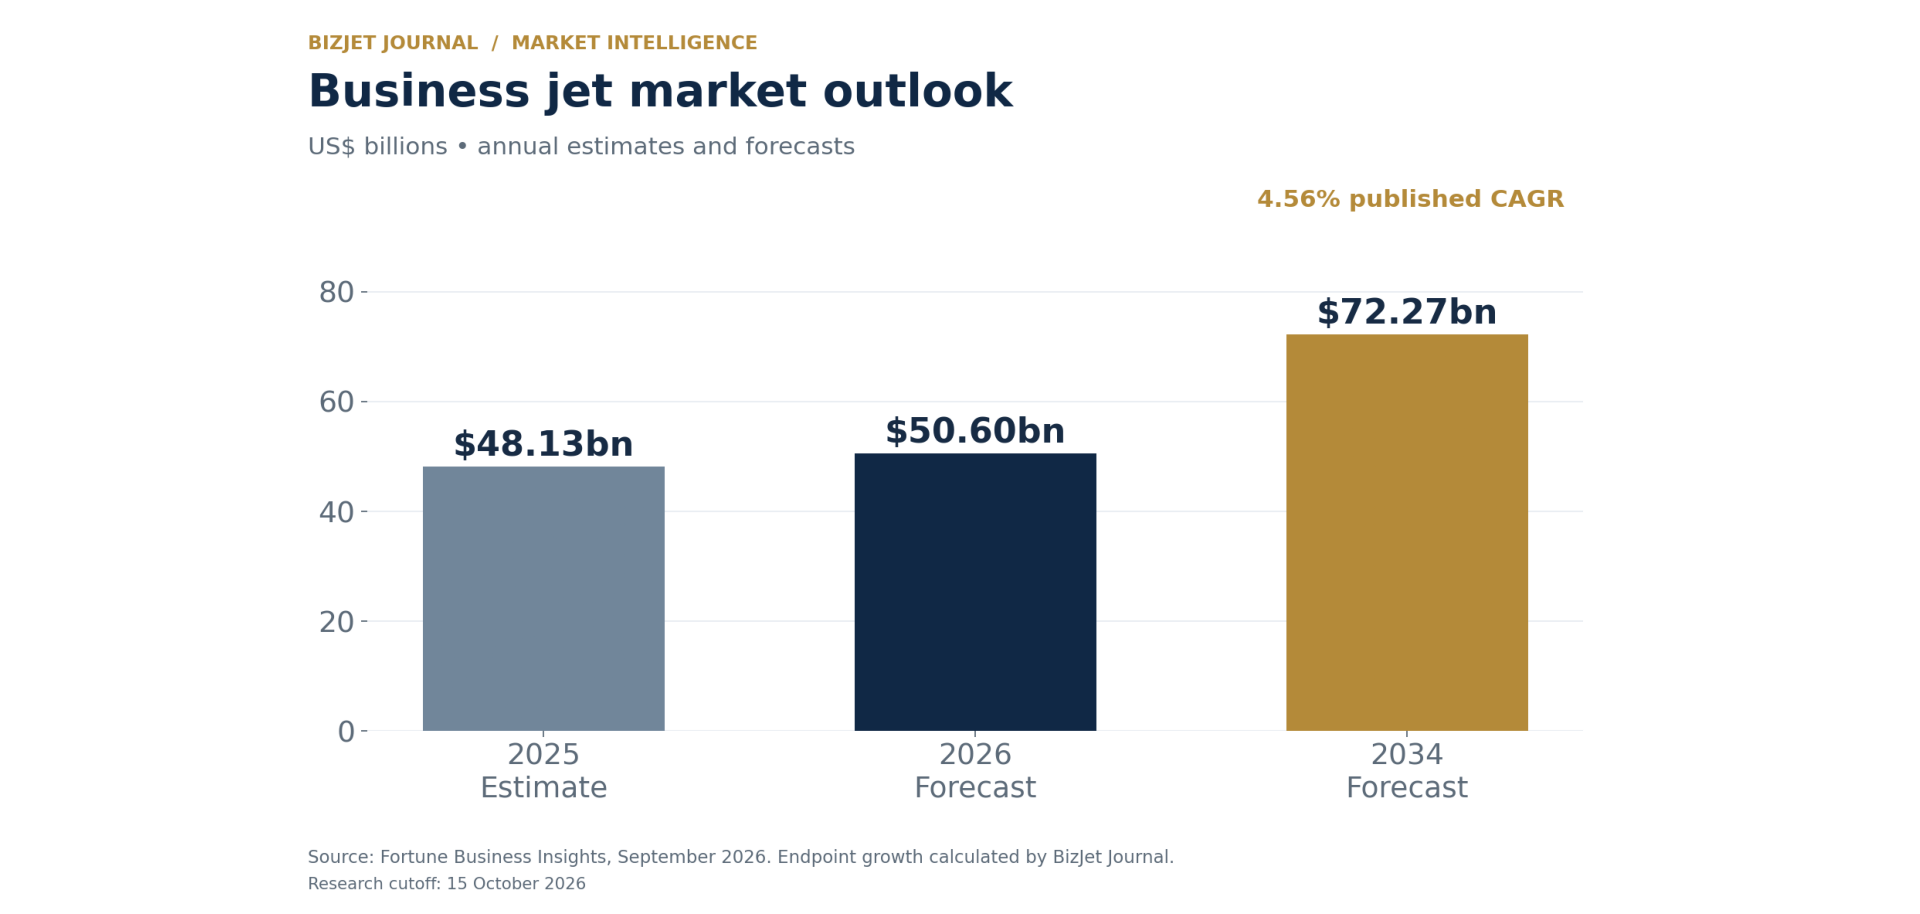
Fortune Business Insights estimates the global business jet market at $50.60 billion in 2026, rising to $72.27 billion by 2034, with a published compound annual growth rate of 4.56%. That is a forecast, not an achieved sales result. The more immediate evidence is encouraging: new-aircraft shipments rose in 2025 and continued growing in the first half of 2026.
This analysis examines the outlook by aircraft type, onboard system, end-user, new versus pre-owned aircraft, and region. It also explains where the opportunity lies for manufacturers, operators, aircraft owners and the companies supporting them.
Business jet market size: the 2026–2034 outlook
| Measure | Value |
|---|---|
| 2025 estimate | $48.13 billion |
| 2026 forecast | $50.60 billion |
| 2034 forecast | $72.27 billion |
| Published CAGR, 2026–2034 | 4.56% |
| Calculated increase, 2026–2034 | $21.67 billion / 42.8% |
Source: Fortune Business Insights, September 2026 update. Growth between endpoints is calculated by BizJet Journal.
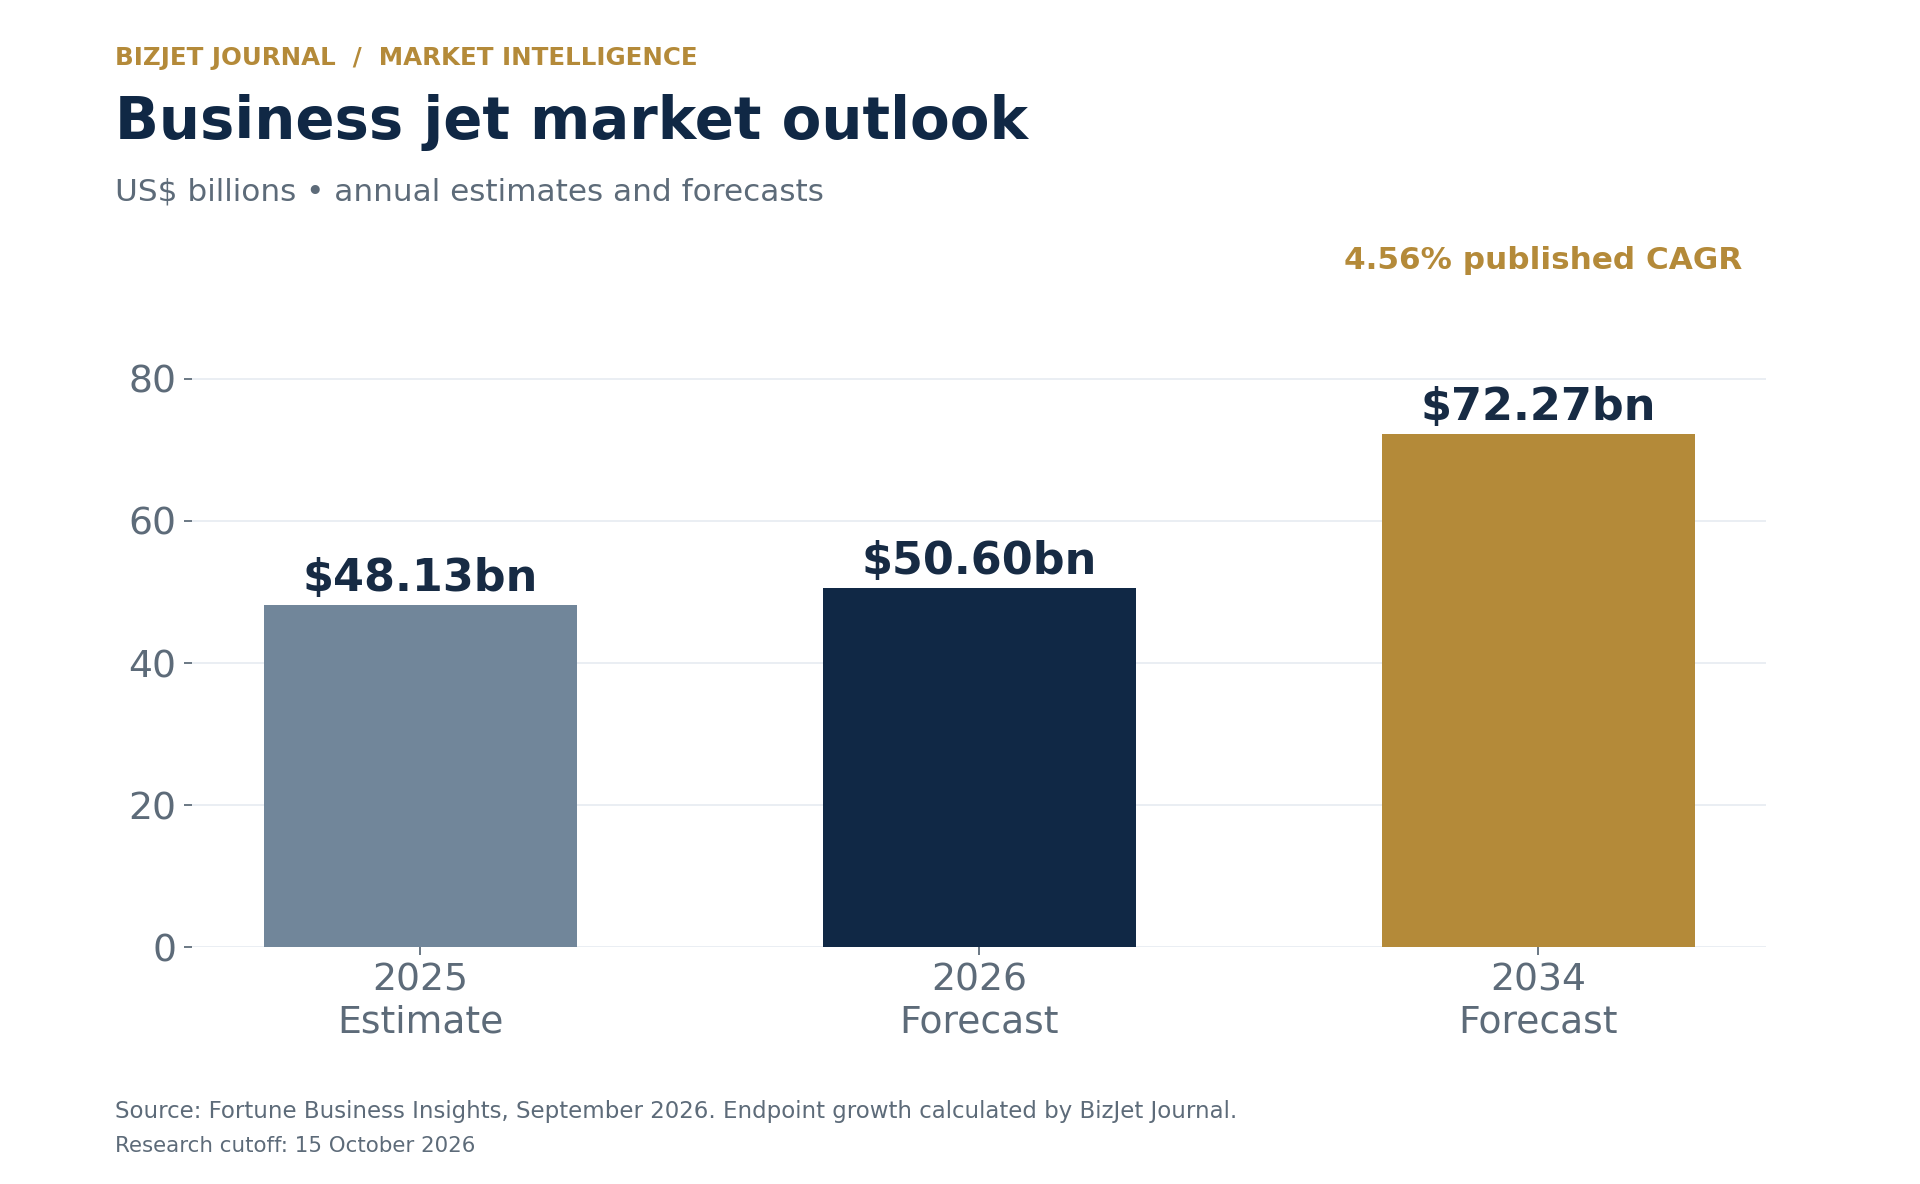
A market can grow in dollar terms without aircraft deliveries growing at the same rate. The mix of aircraft matters: a shift toward larger cabins and longer-range jets increases the value of each delivery. Pricing, equipment specifications and transaction mix can also move the total. The useful question is therefore not just “How big will the market become?” It is “Which activities and products account for that growth?”
There is also a distinction between a forecast’s precision and its certainty. Two decimal places do not make the 2034 outcome predictable to the nearest $10 million. Certification schedules, economic conditions and aircraft availability can change the path substantially.
Why different market forecasts produce different numbers
| Research provider | Published outlook | What the number measures |
|---|---|---|
| Fortune Business Insights | $72.27bn in 2034 | Annual business jet market estimate; new/pre-owned segmentation |
| Honeywell, 2025 outlook | 8,500 jets; $283bn, 2025–2034 | Cumulative new business jet deliveries; expenditure chart in constant 2025 dollars |
| Global Jet Capital, September 2026 | $247bn, 2026–2030 | Cumulative transaction value for new and pre-owned business jets |
The dates and scope above follow the Honeywell outlook PDF and Global Jet Capital’s 2026 forecast announcement. Honeywell’s report explicitly labels its ten-year period 2025–2034. Its forecast should not be silently shifted forward by a year because an article is published in 2026.
These totals cannot be added together or treated as competing answers to the same question. A new aircraft sold once and resold later can contribute to more than one transaction during a multiyear period. That does not mean two aircraft were manufactured. Nor does a cumulative aircraft-purchase forecast measure annual charter-flight revenue.
Actual deliveries show the market’s direction
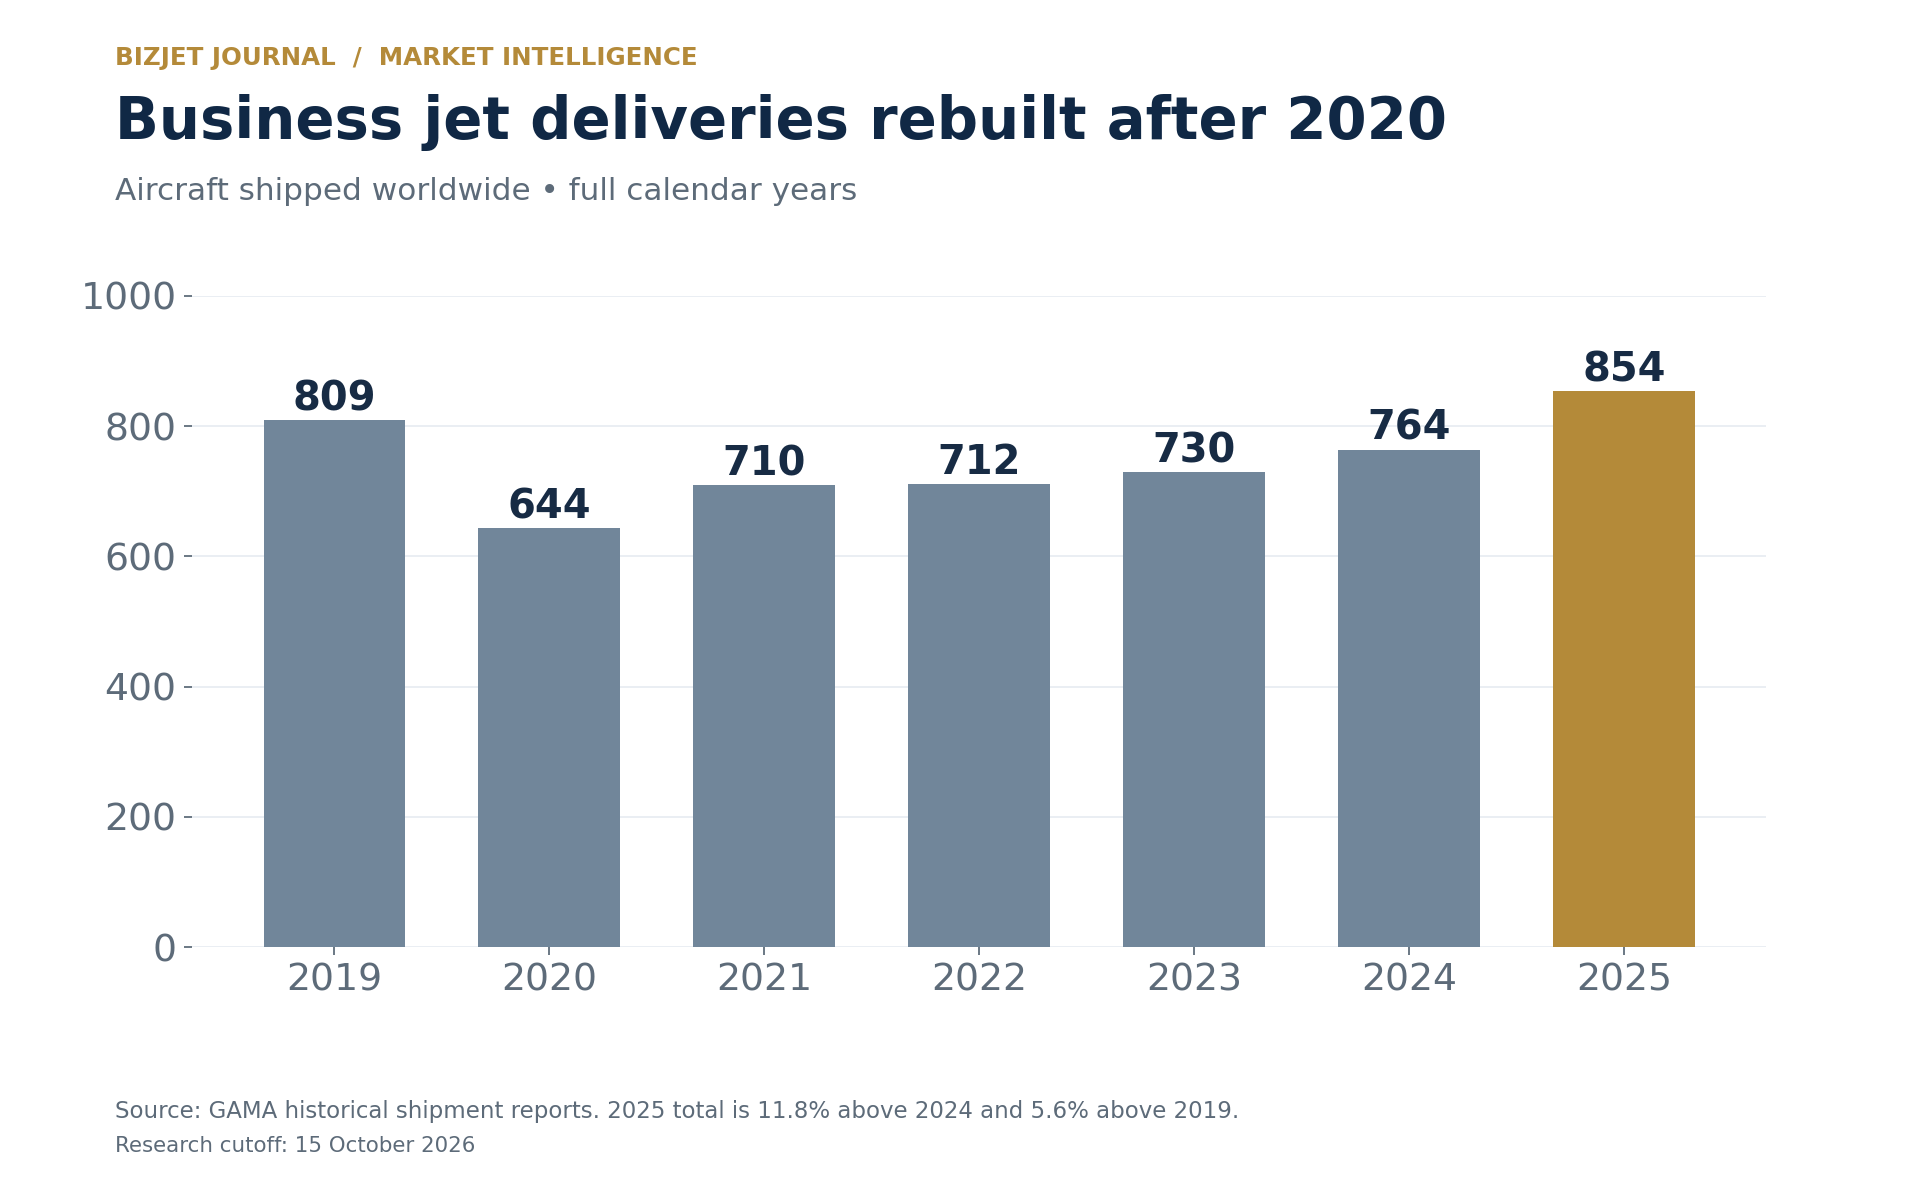
GAMA’s historical shipment series records 854 business jets in 2025, up 11.8% from 764 in 2024. The total was also 5.6% above 2019. The recovery has been uneven: output fell sharply in 2020 before gradually rebuilding.
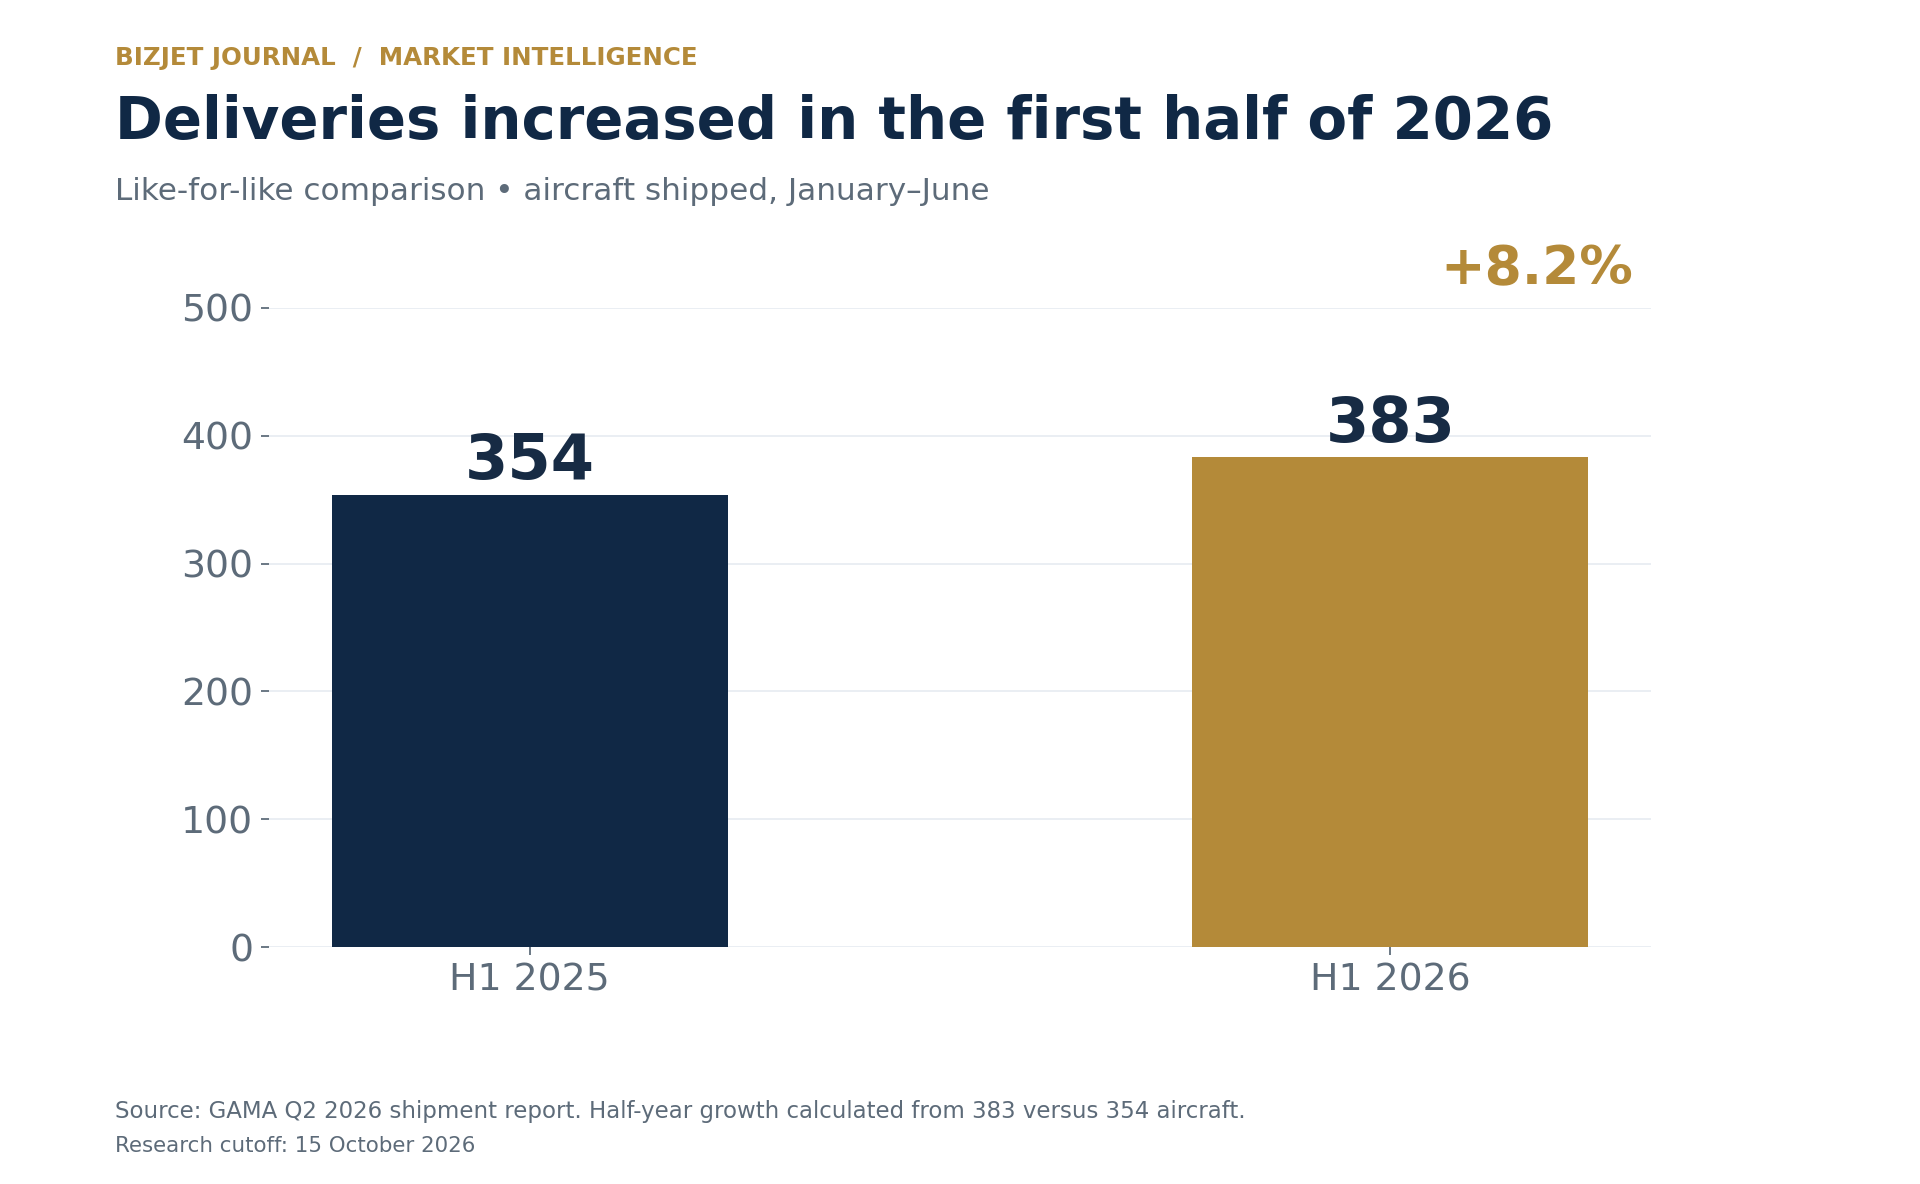
The first-half 2026 report records 383 shipments, compared with 354 in the same period of 2025, an increase of 8.2%. Comparing the same half-year avoids the distortion of putting six months of production next to a full year.
Deliveries are a useful check on market forecasts because they represent aircraft handed over rather than purchase intentions. They still do not reveal everything: a delivery can fulfill an order placed years earlier, and a delayed aircraft can move revenue from one quarter into the next without indicating that demand disappeared.
There is a newer company-level signal, too. Embraer reported 41 executive jet deliveries in the third quarter of 2026. Together with its first-half results, that brings the nine-month total to 115, versus 102 a year earlier, a calculated increase of 12.7%. One manufacturer’s performance should not be presented as the entire industry’s third-quarter result.
Business jet market by type: light, mid-sized and large aircraft
Aircraft categories are helpful, but they are not standardized across every market study. Very light, light, midsize, super-midsize, large-cabin and ultra-long-range labels can be grouped differently. For this article’s three-part framework, very light jets sit within the small-aircraft discussion, while midsize and super-midsize aircraft are considered together. This is an editorial grouping, not a claim about an undisclosed research methodology.
| Segment | Typical purchasing priorities | Representative aircraft families |
|---|---|---|
| Light business jets | Acquisition cost, regional mission efficiency, access and ease of operation | Citation CJ series; Phenom 100/300; HondaJet; Vision Jet at the very light end |
| Mid-sized business jets | Cabin comfort, baggage, productive flying hours and fleet economics | Citation Latitude/Longitude; Praetor family; Challenger 3500 |
| Large business jets | Long-range capability, cabin zones, payload and global support | Gulfstream large-cabin family; Bombardier Global; larger Dassault Falcons; corporate airliners |
Light jets: a different economic proposition
The Embraer Phenom 300E illustrates why light jets remain relevant even when larger aircraft dominate the headlines. A buyer whose flying is mostly regional does not automatically gain value by moving into a much larger aircraft. The decision depends on the actual passenger load, baggage requirement, airport pair and annual utilization.
For operators, the attraction is the ability to match a smaller aircraft to a smaller mission. For private owners, the comparison extends beyond purchase price to crew arrangements, maintenance exposure and the cost of keeping the aircraft available. A lighter jet that fits most trips can be a better business tool than a larger one bought for an occasional exceptional journey.
Mid-sized jets: central to fleet purchasing
The Citation Latitude and Challenger 3500 occupy different parts of a commercially important middle ground. Buyers are looking for a comfortable cabin and useful mission capability while keeping operating economics appropriate for frequent use.
Large fleet agreements help explain the segment’s importance. Flexjet’s Embraer agreement includes Praetor and Phenom aircraft, while Vista’s 2026 Bombardier commitment centers on the Challenger 3500. These are decisions about fleet planning, repeat customer demand and support infrastructure as much as individual aircraft specifications.
The competitive question through 2034 is how much capability manufacturers can add without making the aircraft too costly or complex for its intended mission. Cabin improvements, connectivity, maintenance intervals and dispatch reliability all influence that equation.
Large jets: premium capability supports market value
The Gulfstream G800 and Bombardier Global 8000 show how manufacturers compete at the upper end. Gulfstream’s certification announcement specifies 8,200 nautical miles at Mach 0.85. Bombardier’s December 2025 entry-into-service announcement lists 8,000 nautical miles and a maximum operating speed of Mach 0.95. Maximum range and maximum speed are different operating conditions.
For the market, the implication is broader than a specification contest. Aircraft that reduce fuel stops or provide a more useful working and resting environment can justify a premium for particular missions. That premium helps explain why unit share and spending share diverge.
Honeywell’s 2025 outlook places large jets at about 65% of projected new-aircraft spending, while each of its small, medium and large categories represents approximately one-third of unit volume. That is a useful illustration of the mix effect, not a directly comparable percentage to another provider’s differently defined aircraft segment.
Market share by aircraft type, system and ownership
The reference study’s selected 2026 shares are large jets 39.80%, propulsion 34.07%, and new deliveries 55.85%. The chart shows each against its own remainder. These are three separate classifications and must not be added together.
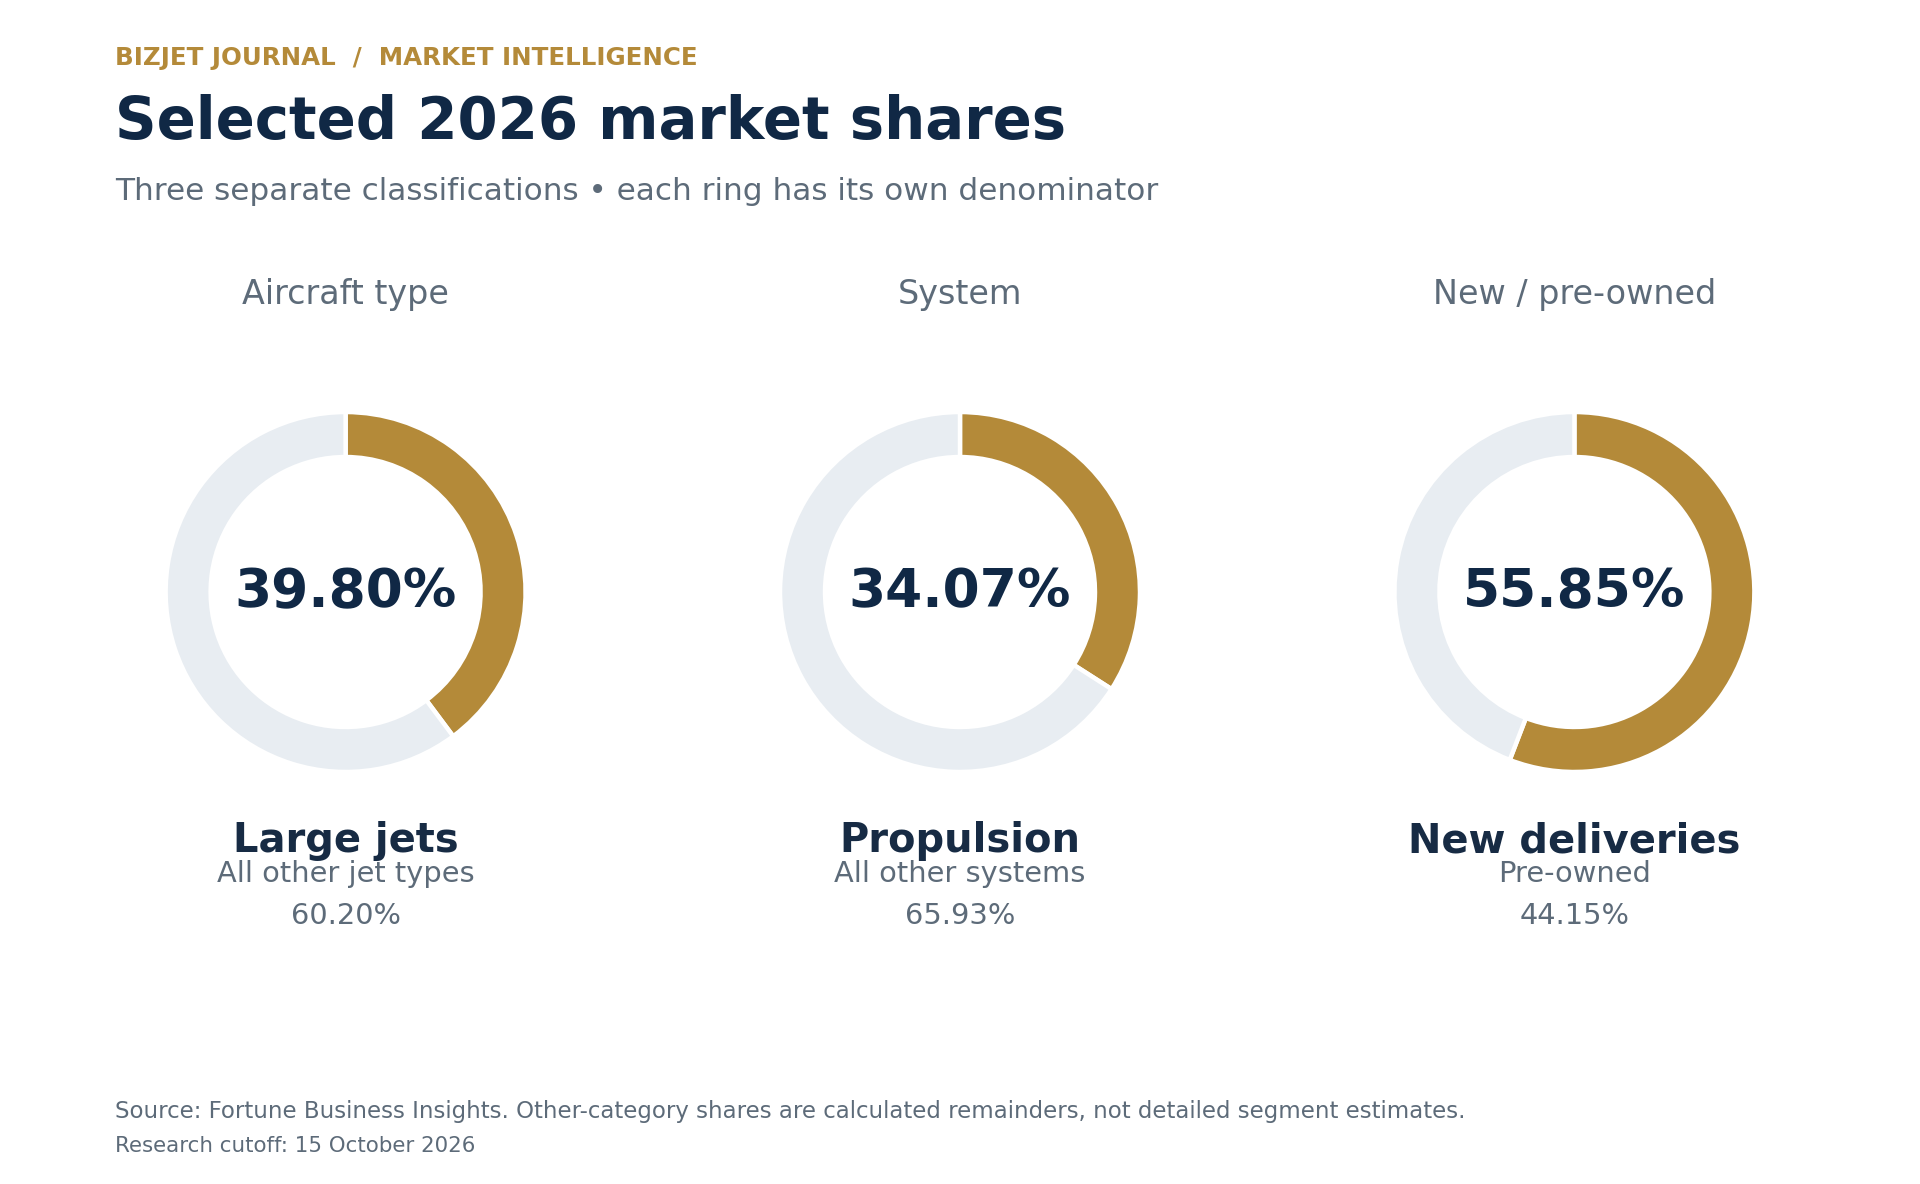
The public material does not provide a sufficiently detailed, consistent breakdown to assign every smaller category a reliable percentage. Accordingly, this analysis does not invent separate shares for light versus midsize jets, individual cabin systems, or every regional market through 2034.
Business jet market by system
A business jet’s economic value sits across several systems, each with a different development cycle and aftermarket opportunity. The aircraft purchase price and the spending on its components should not be counted twice when estimating a total market.
| System | What it covers | Commercial opportunity through 2034 |
|---|---|---|
| Propulsion | Engines, controls and associated equipment | New-aircraft installations, support programs, inspections and overhauls |
| Aerostructures | Fuselage, wings, empennage and structural assemblies | Production increases, aerodynamic improvements and structural repair |
| Cabin interiors | Seating, furnishings, lighting, cabin management and related fit-out | Factory customization, refurbishment and changes of ownership |
| Avionics | Flight displays, navigation, communications and aircraft monitoring | New platforms, supported retrofits and modernization of existing fleets |
| Other systems | Equipment outside the study’s named categories | Electrical, environmental, landing-gear and other support needs; boundaries vary by study |
Propulsion: efficiency and predictable support costs
Engine competitiveness is about more than thrust. Operators also care about fuel consumption, maintenance coverage, spare-engine access and time out of service. A premium engine program has to deliver both mission capability and dependable support.
Rolls-Royce’s Pearl 10X program, developed for the Falcon 10X, illustrates the technology direction: advanced core design, additive manufacturing and testing with 100% sustainable aviation fuel. An engine test does not, by itself, establish that every aircraft installation is approved for unrestricted commercial use of that fuel. The near-term market case remains efficiency, reliability and supportability.
Aerostructures: production execution matters
Wings and fuselages turn a promising design into a deliverable aircraft. A larger order book only becomes revenue when structural assemblies, engines, systems and completed cabins arrive on schedule and meet certification requirements.
For suppliers, the opportunity is therefore tied to actual production rates and the programs they serve. A supplier with a major position on a growing aircraft family can experience a different demand cycle from the industry average. Capacity planning should follow confirmed production schedules rather than the headline value of a decade-long market forecast.
Cabin interiors: new sales and the existing fleet
Cabin spending has two routes to market. New-aircraft buyers specify the aircraft before delivery; existing owners may refurbish an aircraft to improve comfort, connectivity or suitability for their trips. A pre-owned sale can create a new interior project even though it creates no new aircraft shipment.
The commercial judgment is whether an upgrade improves the aircraft’s usefulness and saleability enough to justify its cost and downtime. Expensive personalization does not necessarily return its full cost at resale. For a charter operator, a practical, durable cabin can be more valuable than an elaborate fit-out that increases maintenance or limits passenger flexibility.
Avionics and other systems: upgrades extend the opportunity
Garmin’s business aviation offerings include a G5000 retrofit for Citation Excel and XLS aircraft, illustrating how avionics demand reaches the installed fleet. Such programs can improve the cockpit experience without requiring the operator to purchase a new airframe.
For buyers, the important questions are installation eligibility, downtime, future support and the relationship between the upgrade cost and the aircraft’s remaining useful life. For suppliers, recurring support and modernization create an opportunity beyond the initial aircraft delivery.
End-users: operators and private owners buy differently
The operator category includes businesses acquiring or managing aircraft to provide flying capacity to customers. Private use includes individuals and corporate flight departments acquiring aircraft primarily for their own missions. In practice, management and ownership structures can overlap; a privately owned aircraft may be professionally managed and sometimes made available for charter.
| End-user | Primary purchasing logic | Metrics that matter |
|---|---|---|
| Charter and fleet operators | Match capacity to customer demand and fleet network | Productive hours, dispatch reliability, maintenance downtime, crew and fleet commonality |
| Fractional providers | Support contracted access across many customers | Fleet availability, replacement coverage, aircraft utilization and delivery schedules |
| Private owners and corporate departments | Meet specific travel requirements with control over availability | Mission fit, annual cost, readiness, support and eventual resale |
Honeywell’s October 2025 survey release reported that fractional fleets had expanded by more than 65% since 2019 to roughly 1,300 aircraft. Light, midsize and super-midsize jets accounted for 80% of that fleet. This helps explain why operator purchasing can support several aircraft categories at once.
Fleet announcements: firm aircraft versus options
| Buyer / manufacturer | Announcement | Commitment and interpretation |
|---|---|---|
| Flexjet / Embraer | February 2025 | 182 firm aircraft plus 30 options. Up to $7bn at list prices, including services and support. |
| Vista / Bombardier | February 2026 | 40 firm Challenger 3500s plus 120 options. Deliveries phased from 2026 over up to ten years. |
| NetJets / Textron Aviation | September 2023 | Option to purchase up to 1,500 Citation jets over 15 years. Not a 1,500-aircraft firm order. |
Sources: Embraer/Flexjet, Vista and Textron/NetJets. Options provide flexibility; they are not equivalent to completed sales. Multiyear agreement values should not be booked into one year’s market size.
Our assessment is that fleet purchasing strengthens manufacturers’ production visibility but also concentrates some demand in large customers. The benefit of a sizable agreement must be weighed against delivery timing, option exercises and the buyer’s ability to use the capacity profitably.
New deliveries versus the pre-owned business jet market
The phrase “ownership segment” in a market report can be confusing. New versus pre-owned describes the aircraft’s transaction status. It is a different question from whole ownership versus fractional ownership, leasing or charter access.
New aircraft offer a known production specification and the opportunity to configure the cabin, but the buyer may face a delivery wait. Pre-owned aircraft can provide an earlier route to ownership, although age, maintenance status, records, equipment and refurbishment needs vary considerably.
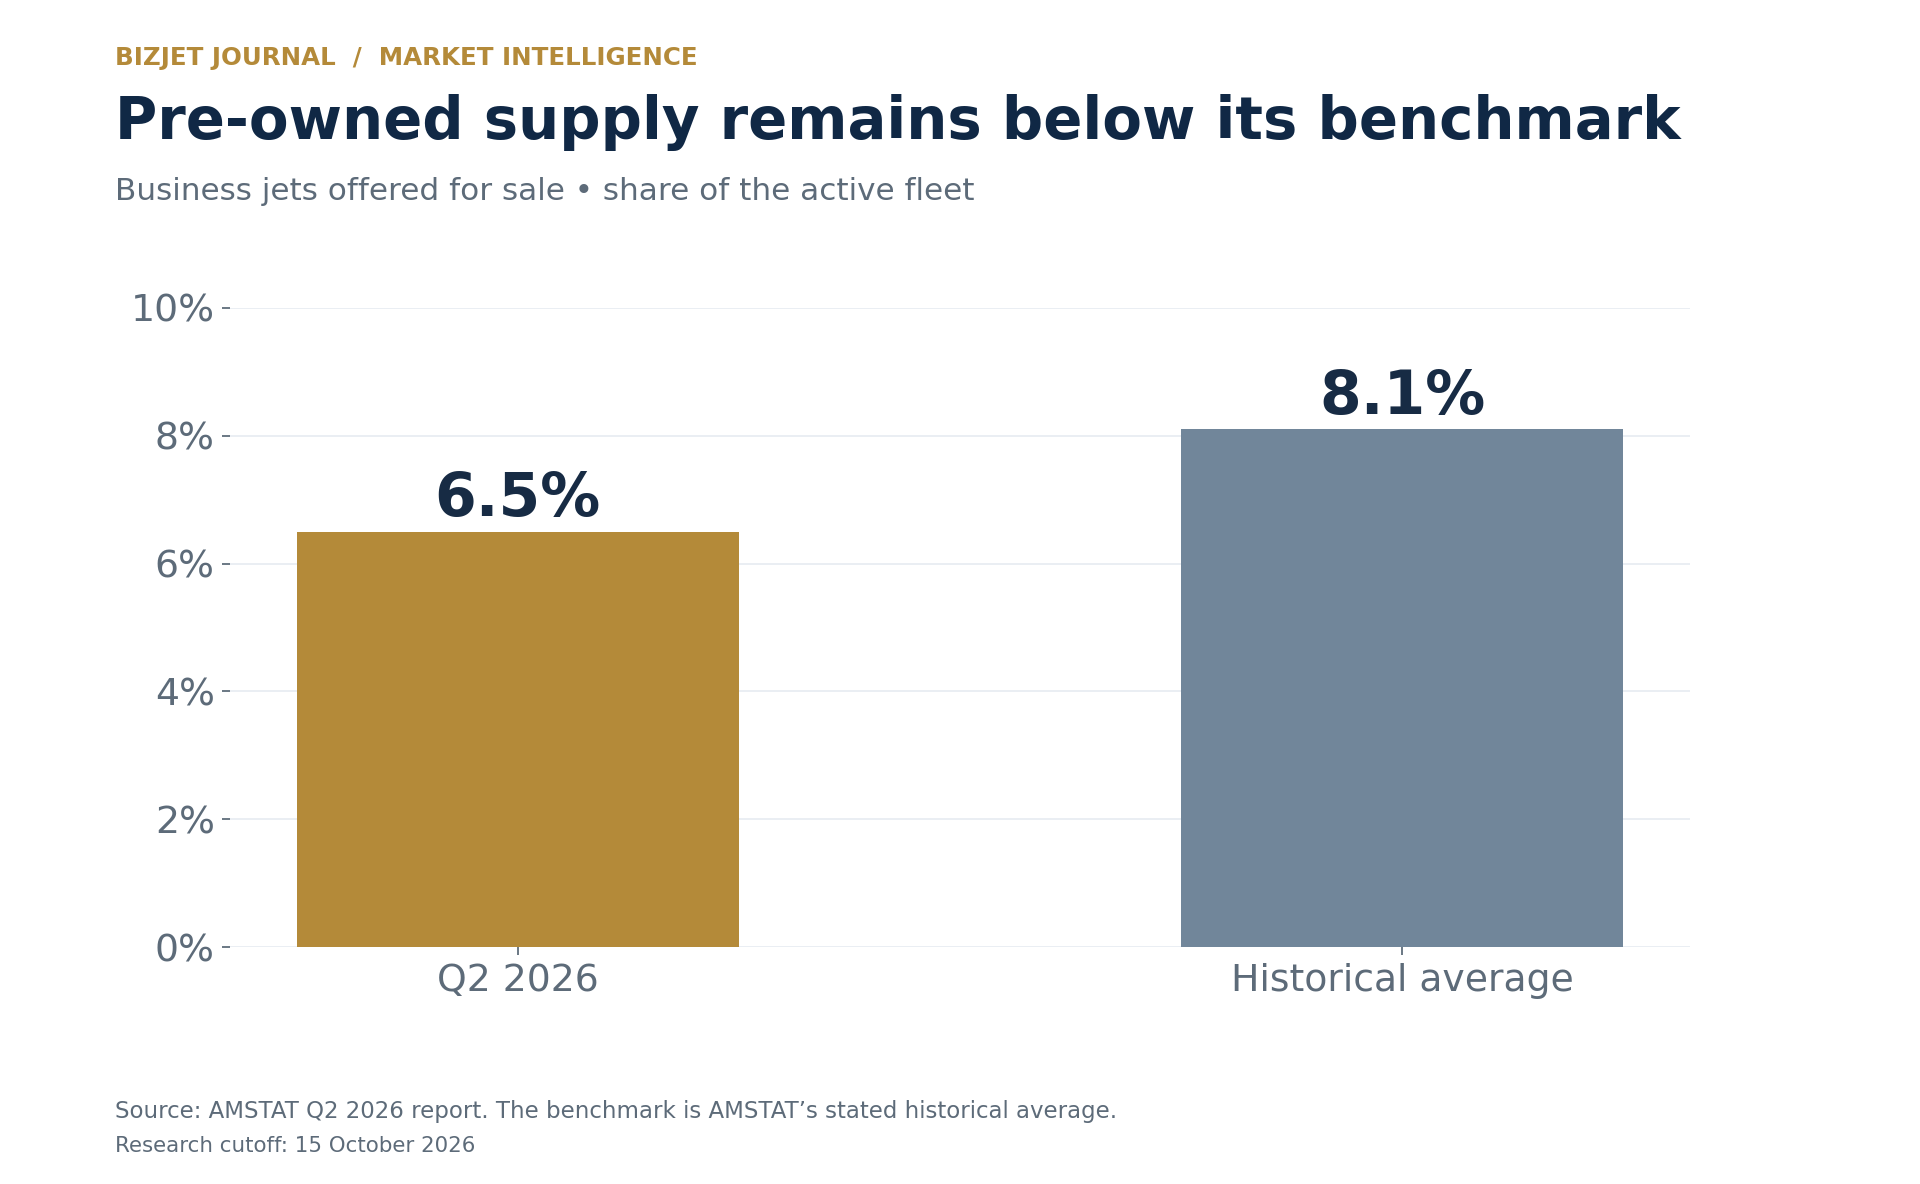
AMSTAT’s Q2 2026 report puts business jets available for sale at 6.5% of the active fleet, below its 8.1% historical average. It reports a 15.5% year-on-year increase in second-quarter jet transactions and a 5% rise in median values. These are jet figures; AMSTAT also publishes broader business-aircraft figures that include turboprops.
A separate JETNET mid-2026 analysis found that 74% of listed inventory was at least 16 years old, compared with 60% in 2019. Its snapshot also recorded substantially shorter selling times for the youngest aircraft. That supports a more useful reading of availability: the number of aircraft advertised is not the same as the number of attractive aircraft available for a particular buyer.
| Decision factor | New aircraft | Pre-owned aircraft |
|---|---|---|
| Availability | Depends on production slot and completion schedule | Depends on suitable listings, inspection and transaction readiness |
| Specification | Greater factory configuration opportunity | Existing configuration; changes may require downtime |
| Maintenance exposure | New-aircraft starting point and applicable warranties | Aircraft-specific inspections, component life and program status |
| Capital decision | Compare actual contract price and delivery timing | Include inspection, rectification, upgrades and near-term maintenance |
Global Jet Capital projects average annual growth of 2.4% in new deliveries and 2.9% in pre-owned transaction units across its five-year outlook. Those are forecasts with a different horizon from the 2034 market estimate. They suggest an ongoing role for both channels, especially when buyers’ preferred new-aircraft delivery positions are unavailable.
For the ownership decision behind these numbers, see our guide to private jet purchase and operating costs. The lowest acquisition price is only one part of the total commitment.
Regional outlook: where business jet demand is concentrated
The map below uses the destination regions of new business jet shipments. It does not show where every aircraft is based, where every flight takes place, or each region’s share of global market revenue.
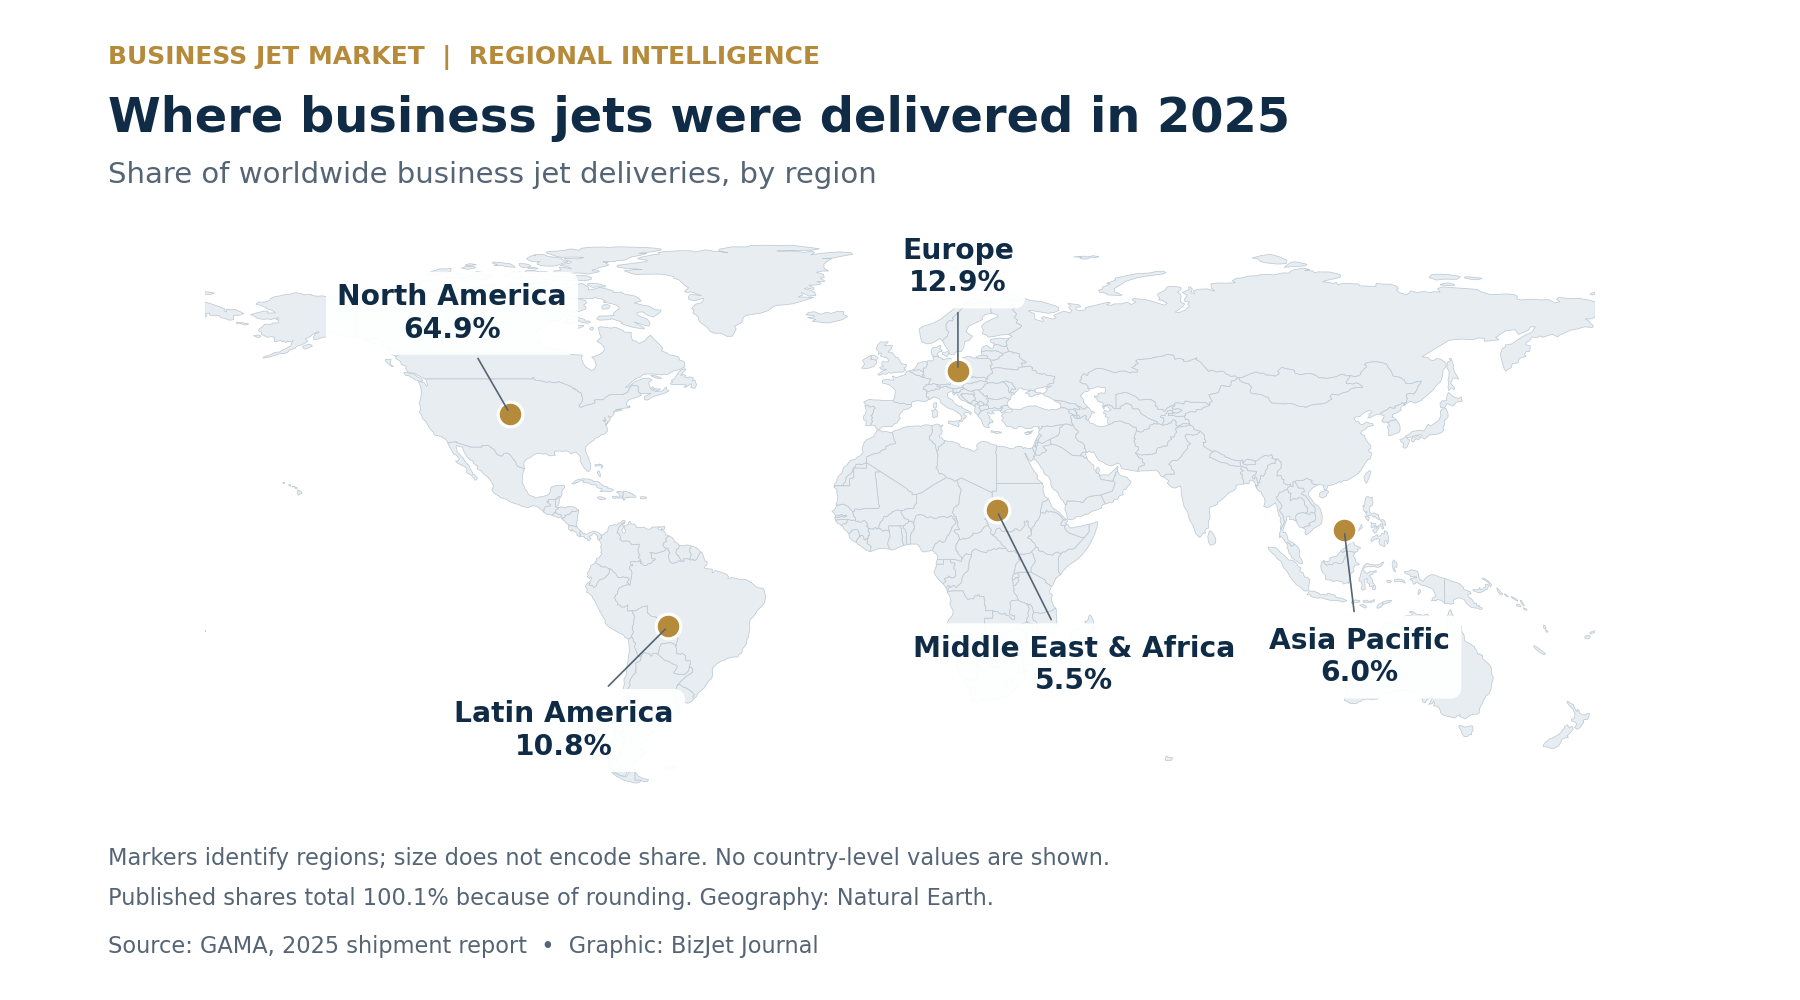
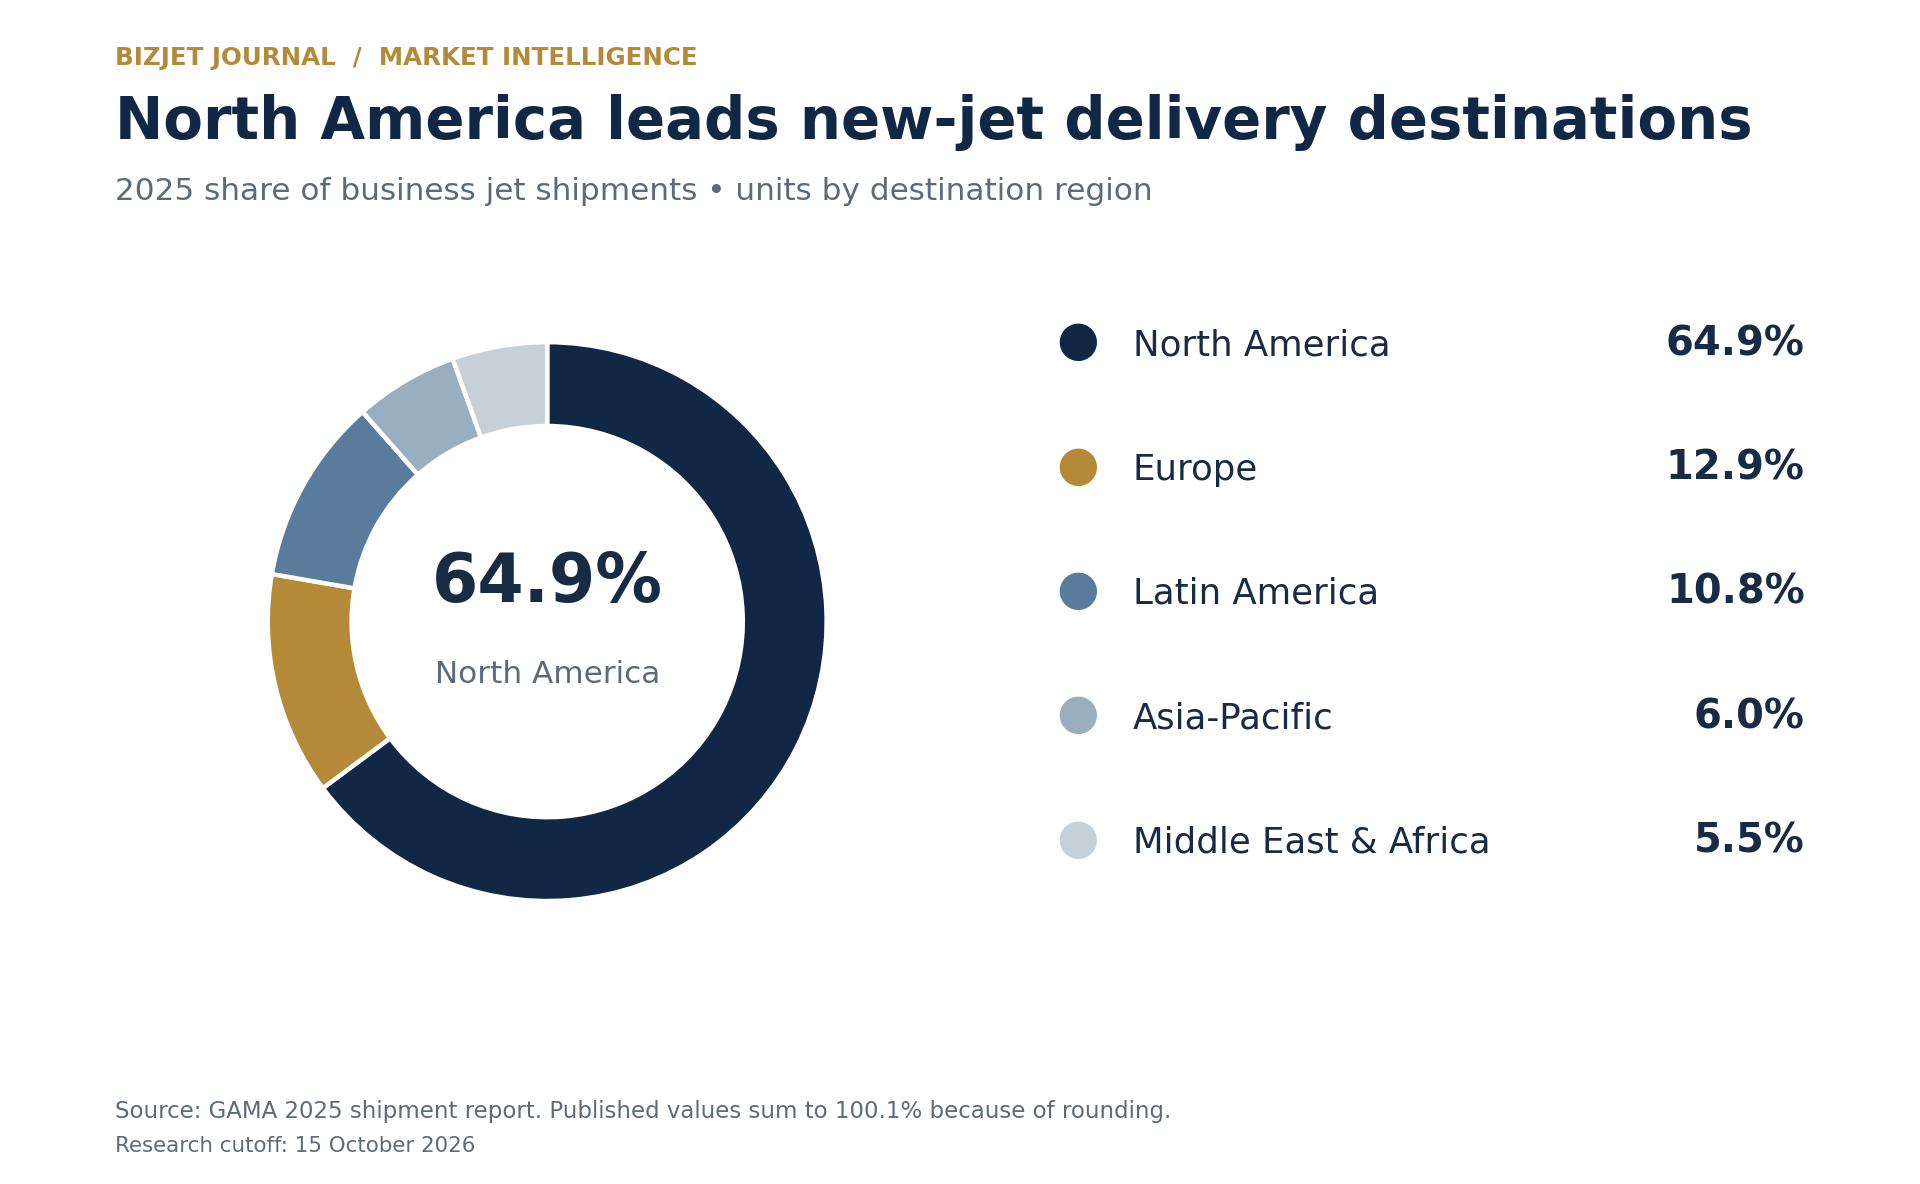
Source: GAMA’s 2025 year-end report. Published regional percentages total 100.1% because of rounding. Map markers identify broad regions; they do not assign the regional figure to the country underneath.
Download the interactive regional atlas to switch between observed 2025 delivery shares and the three-year regional forecast in Honeywell’s 2025 outlook. Open the downloaded HTML file in a browser. The two views describe different periods and methods, so their difference is not a measured growth rate.
North America: the industry’s largest volume base
North America dominates the delivery map and remains central to the fleet agreements discussed above. Its importance extends across new-aircraft demand, the secondary market and aircraft support. For a supplier planning through 2034, the practical question is which customer and aircraft programs it can serve, rather than whether a broad global forecast is positive.
Existing aircraft also create continuing demand. Embraer added Execaire Aviation in Toronto to its authorized network in April 2026, providing line-maintenance support for selected Phenom, Praetor and Legacy models. It became Embraer’s third authorized service center in Canada. Support capacity is part of the market opportunity, not simply an afterthought to aircraft sales.
Europe: fleet renewal and operational efficiency
Europe is the second-largest destination region in the GAMA chart. For the long-term outlook, the commercial case depends on useful aircraft availability, customer demand and the ability to operate efficiently across a varied airport network.
Traffic and deliveries should be monitored separately. EBAA publishes monthly traffic tracking using EUROCONTROL data, providing a more appropriate source for changes in flying activity than a market-size estimate. A region can receive new jets while fleet utilization softens, or increase flying without accepting proportionally more aircraft.
Asia-Pacific: support capacity alongside aircraft capability
For long-distance missions, the aircraft’s advertised range is only part of its value. Owners and operators also need maintenance access, parts support and dependable recovery when an aircraft is unavailable.
Bombardier’s second-quarter 2026 results highlight a planned expansion of its Singapore service center, expected to nearly double capacity when operations begin in the second half of 2028. That is tangible investment behind the regional opportunity. It is a planned capacity increase, not a facility already in operation.
Our outlook is selective: countries across Asia-Pacific have different airport networks, operating conditions and customer bases. A single regional growth assumption is too blunt for deciding where to locate a maintenance business or base a charter aircraft.
Middle East and Africa: separate local opportunities within a combined dataset
GAMA and Honeywell group the Middle East and Africa together in the datasets used here. That grouping should not be read as a claim that the two markets have identical demand or infrastructure.
Saudi Arabia’s General Aviation Roadmap points to expanded business-aviation infrastructure, including FBO and maintenance capacity. For market development, the test is whether infrastructure and operating access translate into a larger, consistently active customer base.
Across the combined region, route economics, support coverage and aircraft availability deserve country-level assessment. A long-range aircraft may serve customers across several regions, making delivery destination alone an incomplete guide to the business it generates.
Latin America: a material market in its own right
Latin America’s position in the shipment chart is a reminder that it should not disappear into a generic “rest of world” paragraph. Operators and suppliers need to consider the mission network, support requirements and local economics of individual markets.
For the period through 2034, our interpretation is that replacement demand and practical mission fit will matter alongside new buyer formation. A premium global product may address some customers, while others will place greater weight on regional capability, acquisition cost and the ability to maintain the aircraft close to its base.
Manufacturer market share and competitive landscape
The production market is concentrated. Calculating shares from GAMA’s manufacturer counts, Textron Aviation, Gulfstream, Bombardier and Embraer together delivered approximately 75.1% of 2025’s business jets. This is a count of aircraft, not a revenue ranking.
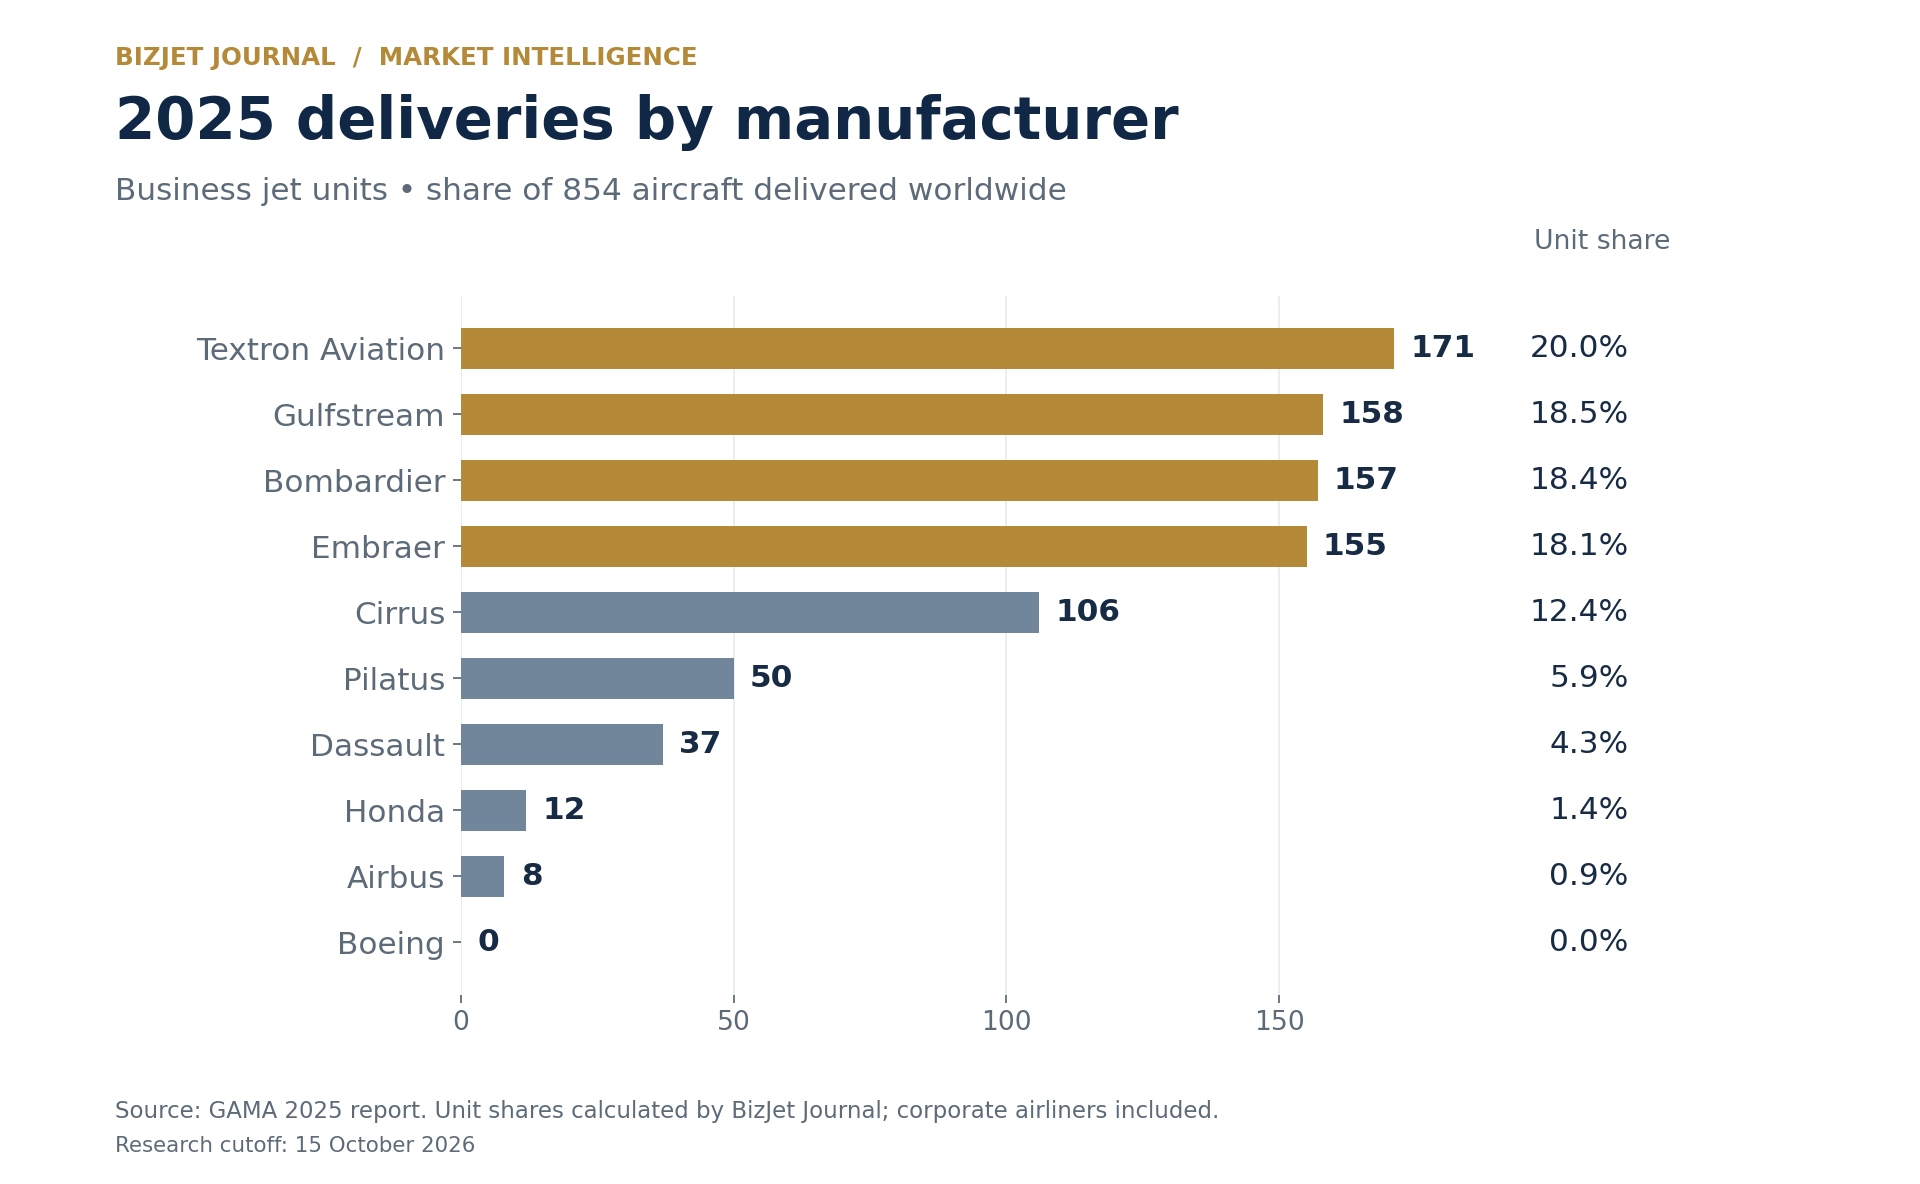
Airbus corporate-airliner deliveries are included in the GAMA dataset; Boeing Business Jets recorded zero in the listed 2025 shipment categories. A zero in one year is not evidence that a manufacturer has left the market. Manufacturers with fewer, higher-value aircraft can have a substantially different position by sales value.
Backlogs show demand, but require careful comparison
| Company or segment | Reported backlog | Date and scope qualification |
|---|---|---|
| General Dynamics Aerospace | $23.977bn | 5 July 2026; Aerospace segment, including funded aircraft orders and future support |
| Bombardier | $21.8bn | 30 June 2026; manufacturing and services, with civil and defense demand |
| Embraer Executive Aviation | $7.8bn | 30 June 2026; Executive Aviation segment |
| Textron Aviation | $8.0bn | Q2 2026; broader Aviation segment, not exclusively jets |
| Dassault Falcon | €5.429bn; 83 aircraft | 30 June 2026; includes Albatros and Archange mission aircraft |
Sources: General Dynamics filing, Bombardier results, Embraer backlog update, Textron results and Dassault results. Different currencies and product scopes make these unsuitable for summing into a single private-jet backlog or turning into a market-share pie chart.
Order books provide visibility, but delivery execution determines how quickly that demand becomes recognized revenue. They also contain different mixes of aircraft, services and mission requirements. For a buyer, a manufacturer’s large backlog can indicate product strength while simultaneously pointing to a longer wait for a preferred delivery position.
What could change the business jet forecast through 2034?
The clearest upside is a combination of repeat fleet orders, successful production increases and demand for newer aircraft capability. The corresponding risk is that demand and supply do not develop at the same pace. An aircraft can attract orders while its manufacturer struggles to raise output; an operator can expand its fleet faster than it develops profitable demand.
| Factor | Stronger-market signal | Potential constraint |
|---|---|---|
| Production | More deliveries with stable support and quality | Supplier shortages, completion delays or certification slippage |
| Operator demand | Productive utilization and repeat customer purchasing | Capacity additions exceeding profitable demand |
| Pre-owned supply | Orderly transactions and viable replacement choices | Scarcity of desirable aircraft or widening maintenance exposure |
| Aircraft capability | New products that solve useful customer missions | Capability upgrades that outpace customers’ willingness to pay |
| Operating environment | Reliable airport access, support capacity and manageable costs | Fuel-cost pressure, financing constraints and geopolitical disruption |
Sustainability will also influence product development and operating decisions. More efficient propulsion, fuel availability and fleet renewal are relevant to the business jet market. Electric vertical-takeoff aircraft, however, should not be inserted into the conventional business-jet delivery series merely because both serve premium mobility. Their aircraft designs, missions and commercialization pathways differ.
For manufacturers and suppliers, the priority is converting demand into supported aircraft in service. For operators, it is matching fleet capacity to productive flying. For owners, it is choosing an aircraft and ownership arrangement that fit actual travel needs. These decisions are more useful than treating a single market-size forecast as proof that every segment will grow equally.
For more context, read how to read business aviation market indicators and our jet card comparison guide.
Frequently asked questions
Is business jet market growth the same as growth in private jet flights?
No. Aircraft sales, pre-owned transactions and flying activity are separate measures. Flight hours can increase through greater use of existing aircraft, while new-aircraft deliveries can rise because manufacturers are fulfilling earlier orders.
Which aircraft category has the strongest market position?
The answer depends on whether the comparison measures units, spending or mission demand. Large aircraft have a strong position by value, while light and mid-sized aircraft remain important to regional flying and fleet programs. Use the same category definitions and denominator when comparing sources.
Does refurbishing a pre-owned jet make it a new delivery?
No. A refurbishment can create spending on interiors, avionics, maintenance and other equipment, but the aircraft remains part of the existing fleet. It should not be added to a manufacturer’s new-aircraft shipment count.
Are options in a fleet agreement guaranteed purchases?
No. Options allow future purchases under agreed terms. A maximum agreement quantity can be much larger than the firm commitment, and both differ from the number of aircraft actually delivered in a particular year.
Can the regional forecast be extended to every year through 2034?
Not reliably from the public evidence used here. The interactive atlas includes a published three-year regional outlook, while the article discusses longer-term regional drivers. It does not manufacture annual regional values or precise 2034 regional shares.
Sources and methodology
Research cutoff: 15 October 2026. Sources are linked beside the relevant claims. This is independent BizJet Journal analysis using public research summaries, industry shipment reports, manufacturer disclosures and specialist aircraft-market data. It is not a reproduction of a paid market report.
Forecasts, observed results and our interpretations are identified separately. Share calculations use the stated dataset’s denominator; percentage growth uses the earlier period as the base. Charts preserve published values and note rounding. No annual forecast points, undisclosed segment shares or confidence intervals have been invented. Aircraft categories and coverage vary by source; tables and charts should be read with their accompanying definitions.